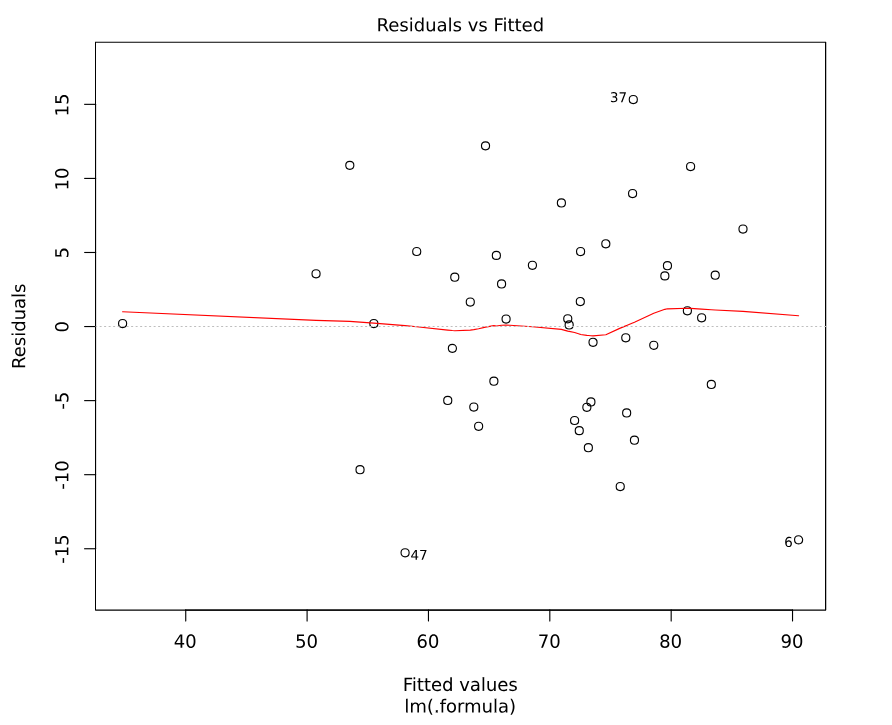
A chart of residual versus fitted values from a regression model. See this Cross Validated post for a discussion of the interpretation of this diagnostic.
Example:
An example output from running Regression - Linear Regression output is shown below.
 Acknowledgements
Uses the plot.lm or plot.glm function from the stats R package.
References
Bock, T. (2018, August 3) What are Residuals? [Blog post]. Accessed from https://www.displayr.com/learn-what-are-residuals